Interesting Facts About Maps
Maps of the world under national seclusion
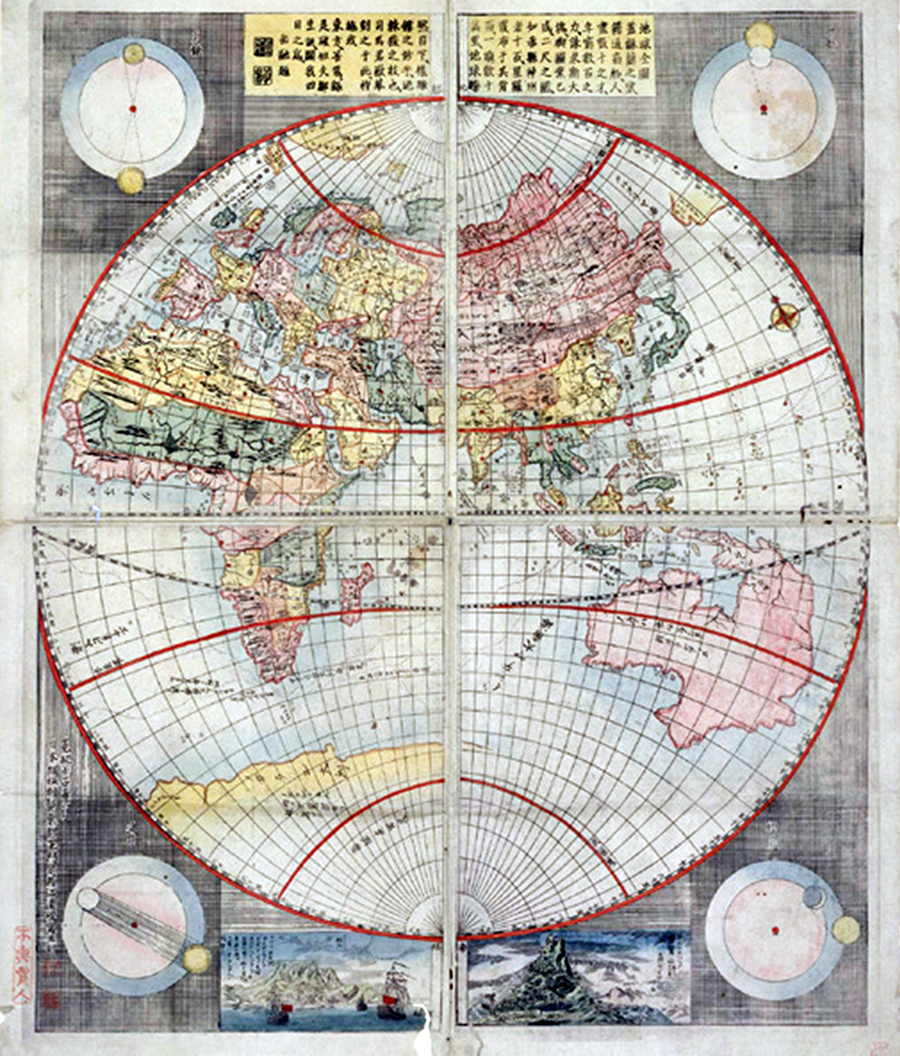
After the Jesuit missionary Francis XAVIER first introduced Christianity to Japan in 1549, missionaries brought a variety of literature, science, and thought to Japan along with their missionary activities. The first Chinese map of the world, the Map of the Ten Thousand Countries of the Earth (Kunyu Wanguo Quantu) published by missionary Matteo RICCI in 1602, was also brought to Japan, copied, printed, and widely disseminated.
Later, during the Edo period, Japan adopted a policy of national seclusion (also known as sakoku), but in 1720, TOKUGAWA Yoshimune relaxed restrictions on the import of Western books, except those related to Christianity, and maps and atlases were imported from the Netherlands.
Based on this new knowledge, SHIBA Kokan, a scholar of Dutch studies in Nagasaki, produced the first copperplate engraving of the Complete Map of the Earth (Chikyu Zenzu). It was the first map produced in Japan to depict Australia.
From "pictorial maps" to "cartographic maps"
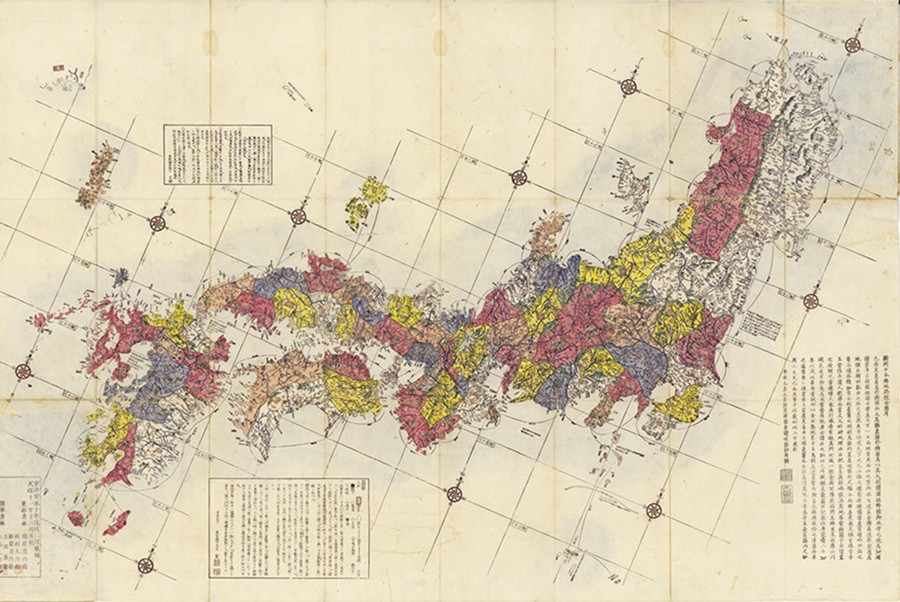
In the middle of the Edo period, empirical thinking began to rise and, in response to "pictorial maps" drawn by ukiyoe artists, a movement to produce geographically correct "cartographic maps" began to emerge.
NAGAKUBO Sekisui, a Confucian scholar of the Mito domain, spent more than 20 years researching information on Japanese geography through interviews, and, in 1779, produced the Revised Complete Road Map of All Japan (Kaisei Nihon Yochi Rotei Zenzu), the first accurate map of Japan with longitude and latitude lines.
Forty-two years after this map, also called Sekisui-zu after its author's name, INO Tadataka completed a map based on actual measurements. However, since this Ino-zu was a government secret, the Sekisui-zu was widely used by the general public and remained in print for 100 years until the Meiji era.
The Old Map Collection of the Geospatial Information Authority of Japan (GSI)
"Phantom island" that was drawn for 500 years
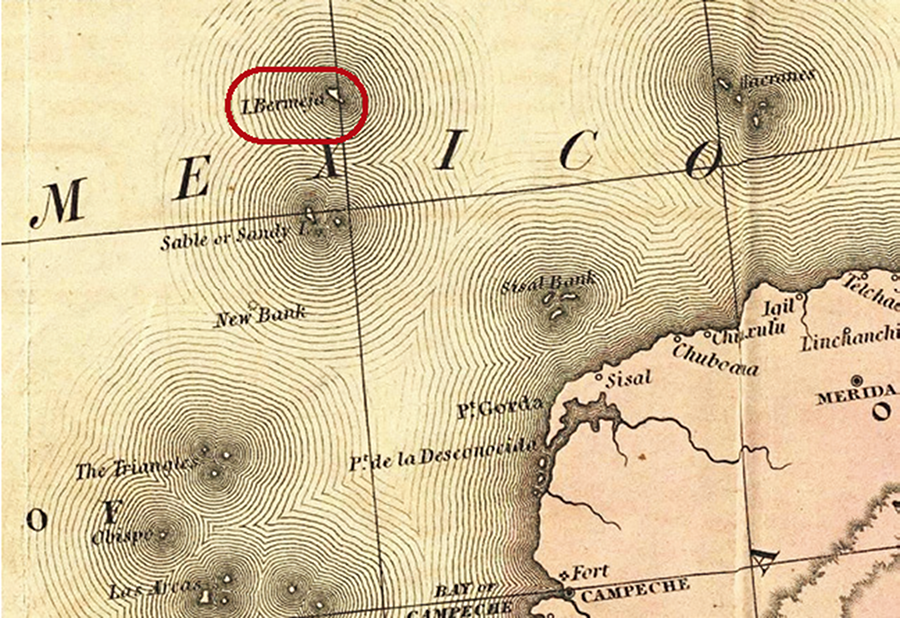
The Island of Bermeja has continued to be depicted in the Gulf of Mexico (north of the Yucatan Peninsula) ever since the Spanish cartographer and historian Alonso de SANTA CRUZ recorded it in his work Yucatan and Surrounding Islands (El Yucatán e Islas Adyacentes) (1539).
Because its location in relation to its neighboring islands was detailed, and other records published in the following year also gave a specific description of the island as being a "reddish islet," the island was subsequently included on many maps without actually being identified. Then, about 500 years later, at the beginning of the 20th century, Mexico conducted a large-scale land survey in order to acquire oil drilling rights. However, the island ended up not being found and was finally removed from maps.
There are several theories as to why the island was not found, including that it was erroneously recorded despite being non-existent from the start, that it moved due to changes in the earth's crust, or that it was submerged by rising sea levels.
Indispensable map projections for the web
When the Earth, which is a sphere, is represented on a flat surface, "distortions" can occur in its area, distance, orientation, angle, shape, and so on.
Therefore, various map projection methods have been devised to correctly represent the necessary elements of maps depending on their purpose. However, every method can correctly represent some elements at the price of some other elements.
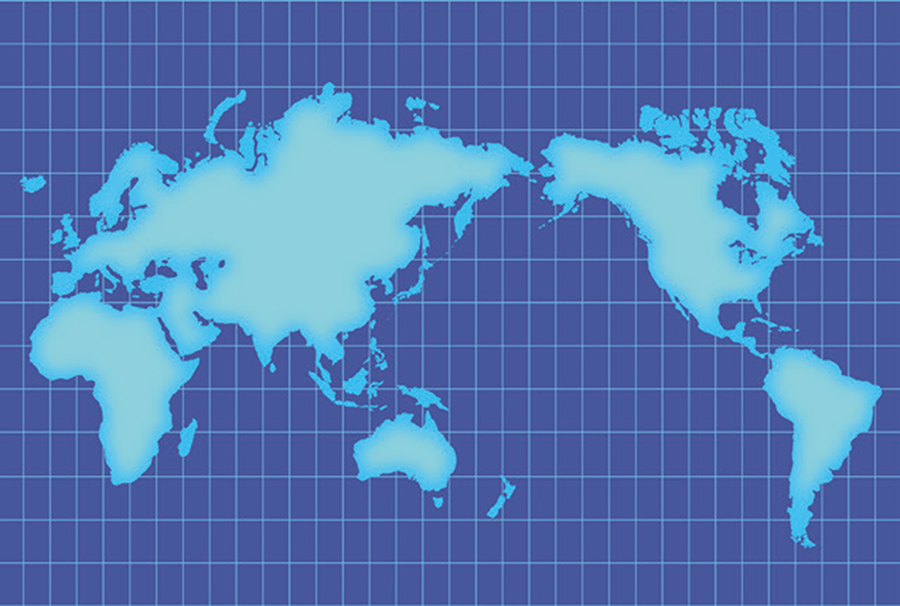
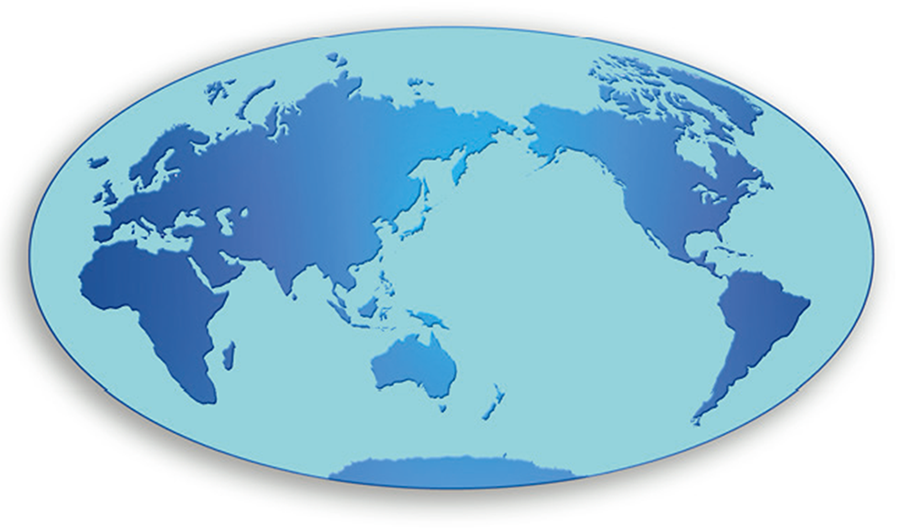
With the Mercator projection, which is used in general atlases, the latitude and longitude lines are drawn to intersect at right angles, so the angles are correct. However, the area becomes larger as the latitude increases, and the North and South Poles are omitted.
Although the Mercator projection has many drawbacks like these, it has the particularity of being able to divide the world into square tiles, making it indispensable for web maps which can be zoomed in and out at will.
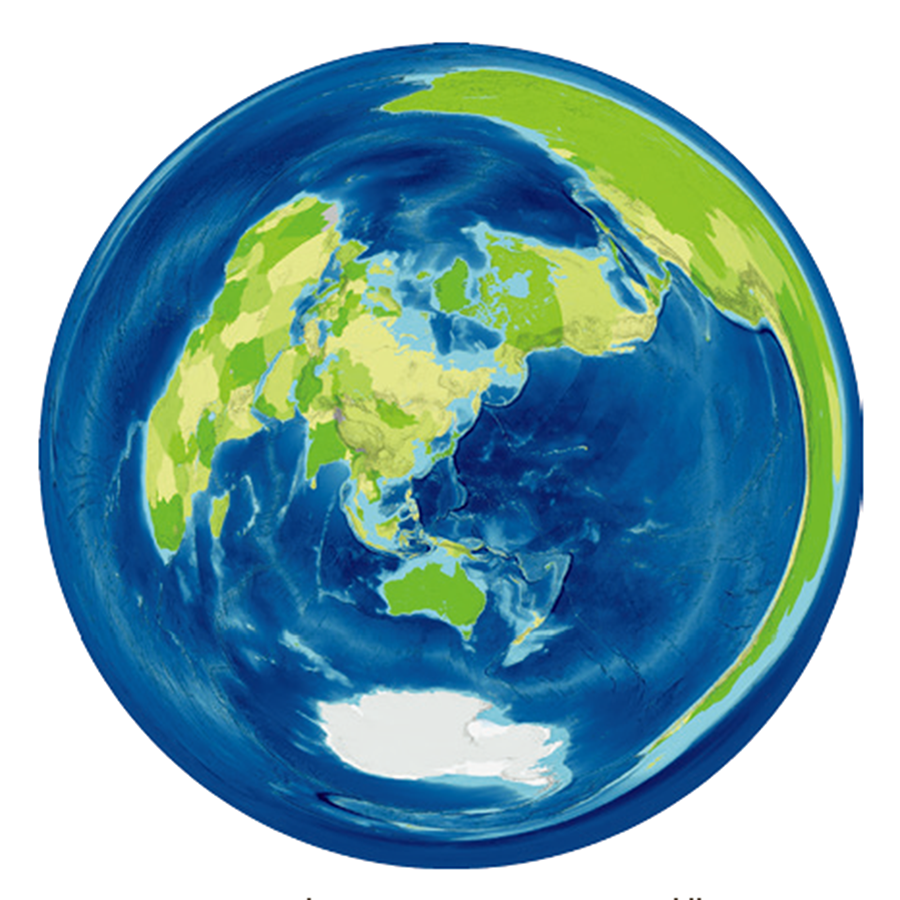
It is used for thematic maps, etc. ©Aflo
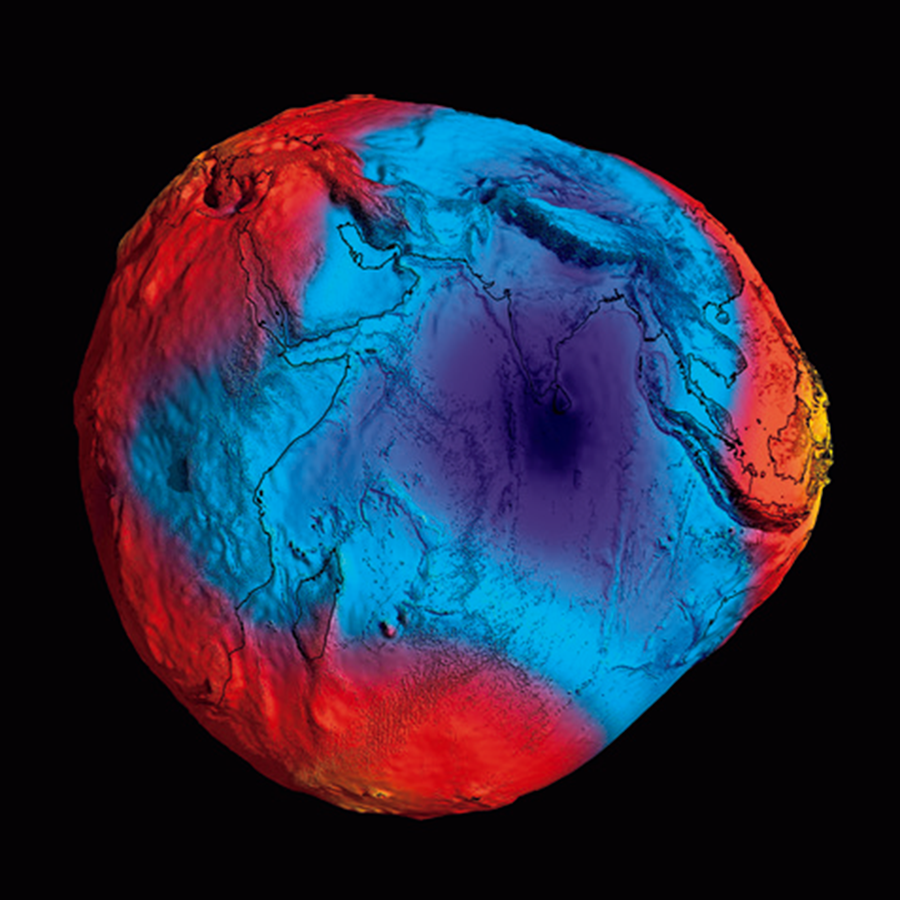
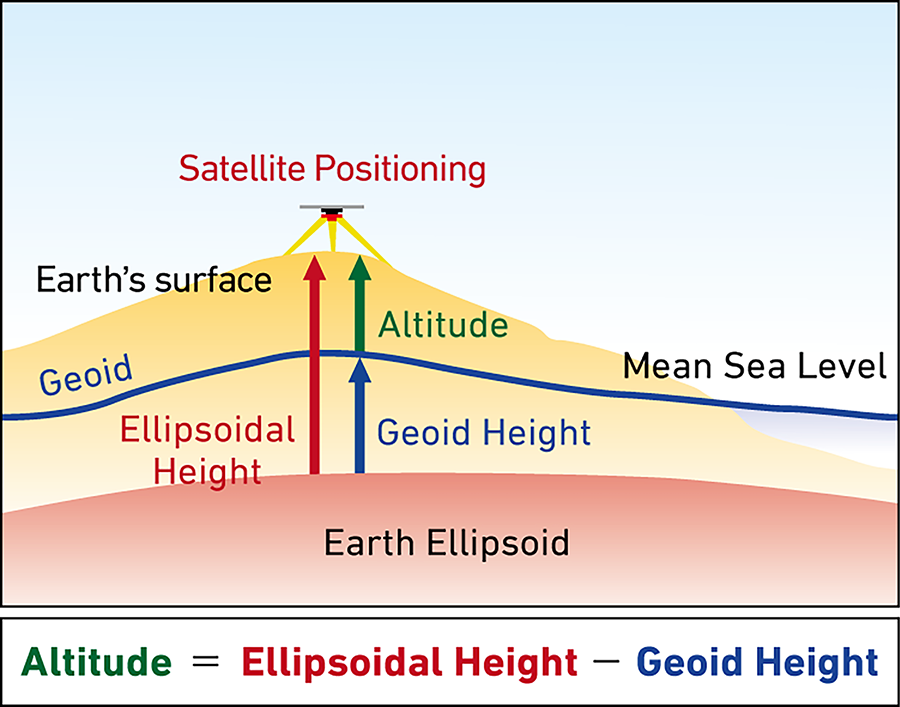
The shape of the Earth and the geoid
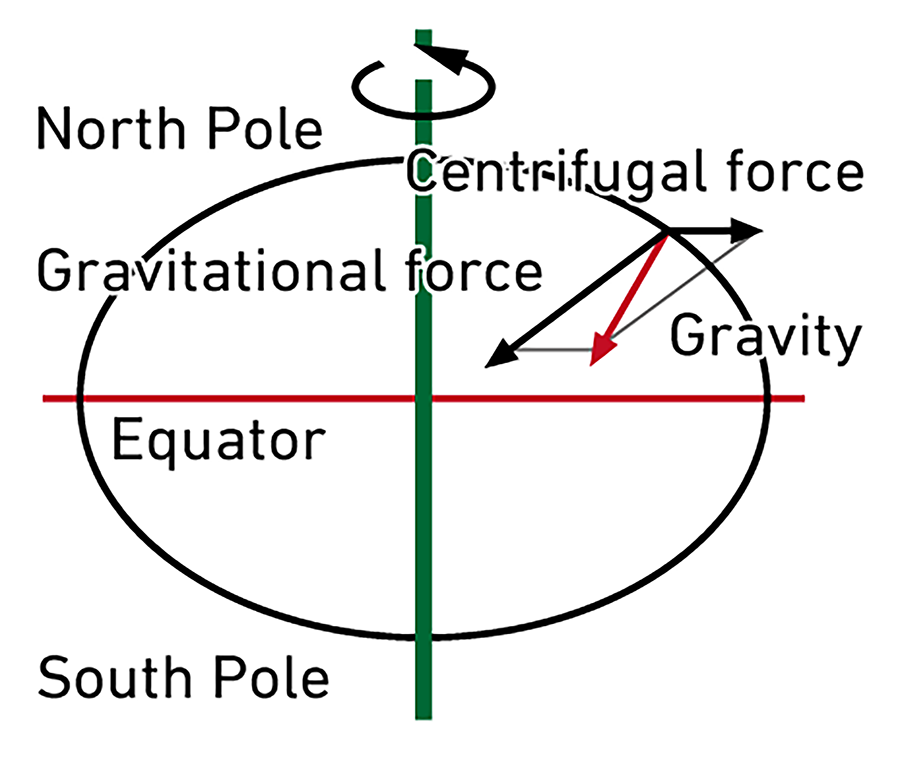
The Earth is said to be round, but in reality, it is not perfectly spherical. It is a rotating ellipsoid that bulges in the equatorial direction due to its rotation, and that is called the "Earth ellipsoid."
In addition to gravitational force, centrifugal force also acts on Earth due to its rotation. The combined force of gravitational attraction and centrifugal force is gravity, and its magnitude varies from place to place.
Altitude (height above sea level), which is an important piece of basic information for maps, is obtained by measuring the height of the mean sea level (measured at the Tokyo Bay in Japan).
Generally, water flows from higher to lower elevations, but even on a flat surface, if the gravity values are different, the water will flow from the place with lower gravity to the place with higher gravity. Therefore, in order to obtain altitude in a way that takes gravity into account, the mean sea level, which is equal to the equipotential surface of the earth's gravity field, is hypothetically extended to the land, and this is what is defined as the "geoid" and used as the basis for altitude (zero meters above sea level). The height measured between the geoid and the Earth's surface with the direction of gravity is what is called "altitude."
Null Island, a popular imaginary island
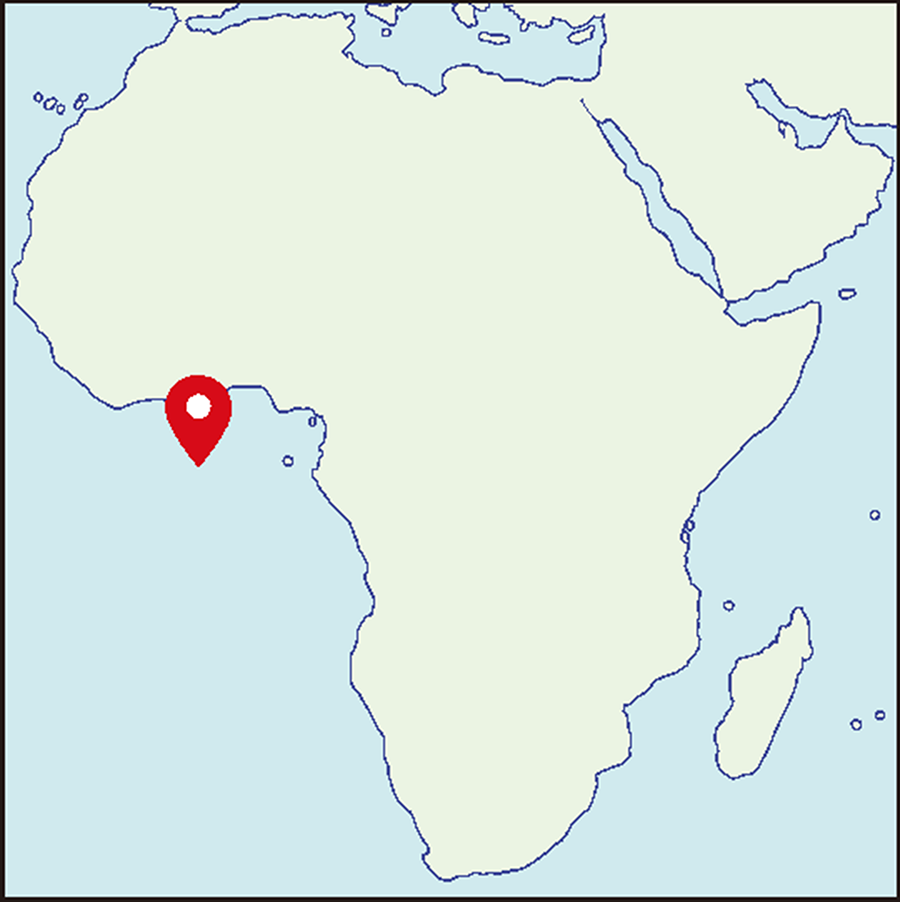
In the mapping software Natural Earth, "Null Island" is marked on the Gulf of Guinea at the intersection of the equator and the prime meridian (the reference meridian at a longitude of 0 degrees 0 minutes 0 seconds). In order words, "Null Island" is written at the point 0,0 where both longitude and latitude are zero. Just as its name "Null" suggests, there is actually no island at the location shown on the map.
Null Island was placed there as a formality so that if a coordinate error were to happen in a mapping software, it would not interfere with statistical processing. Meanwhile, when taking pictures with smartphones and other devices, if the location information function is not working properly, the data is tagged with 0,0, causing a large amount of image data to be tagged in this imaginary island. In this way, the non-existent Null Island became a globally popular photo spot in terms of data.
Disaster prevention and maps

There exists a close relationship between topography and natural disasters, as similar disasters occur repeatedly in similar areas. Whenever our ancestors suffered from such damage, they engraved the circumstances and lessons learned from what happened on stone and other monuments, and passed them down to us, the future generations.
In order to utilize the valuable messages from the past in these "Natural Disaster Monuments" for disaster prevention, the GSI has designated a new map symbol for them and has been including them on GSI maps and its Topographic map of 1:25,000, etc. since 2019. Web maps that allow users to check detailed information on disasters are utilized by schools and local communities. The GSI engages in the maintenance and provision of geospatial information and other activities that contribute to disaster prevention and mitigation, such as the daily monitoring of changes in the earth's crust using mapping and land surveying techniques.
[Main References]
- Japan Cartographers Association, ed. (2021). Encyclopedia of Maps (Chizu no Jiten). Asakura Publishing.
- ENDO, H. (2023). Exaggeration, Omission, Redrawing...Maps Are Unexpectedly Deceptive (Kocho, shoryaku, kakikae...Chizu wa igai to usotsuki). Kawade Shobo Shinsha.
- BROOKE-HITCHING, E. (2017). The Phantom Atlas: The Greatest Myths, Lies and Blunders on Maps (Sekai o madowaseta chizu: Densetsu to gokai ga unda boken no monogatari). Nikkei National Geographic.
- TSUKIO, Y. (Apr. 2023). Science and Technology Stories You'll Want to Tell Someone: 'Maps' That Include Non-Existent Places (Dareka ni oshietakunaru kagaku gijutsu no hanashi: Sonzai shinai basho ga kisai sareta 'Chizu'). Tsushinbunka.
- Geospatial Information Authority of Japan (GSI)'s Website
- The first page
- Previous page
- page 1
- Current page: page 2
- 2 / 2
The issue this article appears
No.64 "Map"
Maps invite people into the unknown, and people get thrilled when presented with one―a simple sheet of paper.
From maps carved into rocks and historically ancient maps used in old times, to digital maps made by satellite in the modern era, we humans have been perceiving the world through a variety of maps.Not only do they help us visualize the world’s shape and overall appearance, but sometimes imaginary worlds are also constructed based on them.
In this issue showcasing various maps, we examine how people have been trying to view the world and what they are trying to see.In the Obayashi Project, we took on the challenge of deciphering and reconstructing in three dimensions a fictional city map called the Hashihara Castle Town Map (Hashiharashi Joka Ezu) drawn by Kokugaku scholar MOTOORI Norinaga when he was nineteen years old.
(Published in 2025)
-
Gravure: Is this also a map?
- View Detail
-
What Is a Map?
MORITA Takashi
(Professor Emeritus, Hosei University) - View Detail
-
The Frontiers of Maps: From the Present to the Future
WAKABAYASHI Yoshiki
(Professor Emeritus, Tokyo Metropolitan University) - View Detail
-
Visible World, Invisible World
OTA Akio
(Professor, Department of Visual Communication Design, College of Art and Design, Musashino Art University) - View Detail
-
The Dreams and Solitude of a Youth Who Drew Maps
YOSHIDA Yoshiyuki
(Honorary Director, Museum of Motoori Norinaga) - View Detail
-
OBAYASHI PROJECT
Deciphering the Hashihara Castle Town Map: The Imaginary Town of MOTOORI Norinaga
Speculative Reconstruction by Obayashi Project Team
- View Detail
-
FUJIMORI Terunobu’s “Origins of Architecture” Series No. 15: Japanese Datum of Leveling Monument
FUJIMORI Terunobu
(Architectural historian and architect; Director, Tokyo Metropolitan Edo-Tokyo Museum; and Emeritus Professor, University of Tokyo) - View Detail
-
Interesting Facts About Maps
- View Detail