What Is a Map?
MORITA Takashi
(Professor Emeritus, Hosei University)
Drawings and maps
The field of construction makes extensive use of drawings and maps. However, their use has become so commonplace that there is little discussion of what it means to represent something on a map. Professional education in drawing, cartography, and surveying focuses on how to represent the shapes and dimensions of buildings and plots of land in an accurate manner. However, in the course of planning and design, thinking may also take place at the same time as drawing. The way in which maps are drawn can make a difference in how one thinks. With respect to the development of such thoughts, there has hardly been any discussion of maps as a "method" of thought that makes use of the visual as opposed to "understanding something upon seeing it."
The general image of maps includes the positive attitude among some people that they are "useful and interesting," while others may have the unwelcome view that maps are "difficult and tedious." In addition, some people have said that maps are no longer needed given the widespread use of GPS, and in recent years, drivers do not need maps at all in an automatic driving setting. However, it is important to understand that this is limited only to the case of using maps to find one's way to a pre-determined location, which represents a tiny fraction of the diverse range of possibilities offered by maps.
Various types of maps with different scales and purposes exist, starting with the globes that are 3D. Hazard maps and three-dimensional digital models of urban areas have also come into use in recent years. What these maps have in common is the fact that we do not see the objects themselves but instead symbolic information represented on a medium, from which we infer the objects as the meaning of such information. Communicating in this way through the process of substitution is a linguistic act, and the concept of cartographic language exists for maps. Maps can take a variety of different forms, including drawings on paper, images that change dynamically like digital maps on a display, and even images in one's mind before they are substituted by something else. What is a map again? Let us explore the beauty of maps from various angles.
The oldest map?
How far can the oldest map in the world be traced back to? A question like this is equivalent to asking when the spoken word first emerged among human beings, which is not known. However, it is known that we have found objects from the past that resemble physical maps. Among them are mountains and rivers drawn on animal tusks, volcanoes and settlements drawn on the walls of caves, and settlements carved into rock, but since writing had not emerged yet, we cannot confirm what they represent. Moreover, because several thousand years have passed, it is difficult to corroborate the spaces drawn with actual spaces of the present.

This map was carved into the rocks of a glacial valley around 5,000 years ago (Neolithic period, Bronze Age). Writing had not been invented yet.
©Luca Giarelli / CC-BY-SA 3.0
It is also easy to imagine that people may have drawn maps on the ground using a stick. If humans had developed a structural understanding of large spaces through conversion into symbols by simplifying and abstractly representing rivers, roads, etc., as lines and target objects as dots, it may be human nature to make use of such a language of maps in the same way as the spoken word. Unfortunately, no evidence of this remains.

Maps are drawn for the purpose of communication. A map consists of the real world, spatial images in the mind, a tool for drawing, the drawn map, a medium of representation, an explanation of the map, and the person with whom one is communicating.
In Japan, the Map of Reclaimed Fields at Todai-ji Temple (todaiji kaidenzu), which was created around the 8th century, still exists. The map illustrates the grid-like layout of farmland and shows how land was managed under the Ritsuryo system during that period. Large spaces are reduced in size in maps and drawings. While house plans are drawn at scales of around 1:100 and city plans at 1:2500, topographic maps by the Geospatial Information Authority of Japan use even smaller scales of 1:25000 or higher. The zoom factor of a camera ranges from several times to several dozen times, allowing the correspondence between the image and the actual object to be grasped intuitively, but this is more challenging with topographic maps, whose images are several thousand times smaller than the actual objects.

Nara National Museum Collection.
Source: ColBace (https://colbase.nich.go.jp/)
Although the map mentioned above was drawn on kozo paper, made from kozo (paper mulberry) fiber, it was not drawn while observing the target space in the same manner a sketch would be. It illustrates the structure of the drawn whole, i.e., the relationship between the parts and the whole. The grid-like layout of the farmland makes it easy to determine the relationship between locations.

If the site was developed based on the map, the map would have also served as a plan, with the site developed as if it was a full-scale version of the map. Features such as mountains, trees, and ponds have been drawn in for on-site corroboration, but they take the form of symbolic representations instead of sketches. Interestingly, a fish-like shape was drawn in one of the ponds, but the intent of this remains a mystery since creatures are not landmarks that can be used for on-site corroboration.
Perhaps the map maker felt uncomfortable about representing the pond with only a shape and fill color, and wanted to add a fish in the form of a symbol as a reminder.
Children and maps
The use of language involves both syntax, or how we choose what we wish to say and the order of our words, and semantics, or whether the meaning of what we say is conveyed as intended. The same applies to maps, which involves selecting the kind of cartographic symbols used to stand in for what we wish to say as well as the order of these symbols, and evaluating the extent to which such a map successfully conveys what we wish to say. And, just as our native language taught to us by our parents, it is necessary to learn some form of visual representation. At what age does a person become able to draw a map?

This map was drawn by a fourth-grader (age 10) of the neighborhood around their home. With the paper before them, they drew their home in the center of the lower foreground closest to them. From there, the map moves upward away from the student, through the elementary school to the playground they often play at. The river, park, and pond are placed vertically on the left-hand side, while the right edge of the map ends with the road. What we notice is that everything depicted is a symbolic image. For example, the trees have the same shape and are not sketches of the actual trees. However, the image clearly conveys the fact that it represents a tree and looks good.
The spatial layout is also not proportionate to actual distances but has been expanded and contracted as necessary to simplify the structure. Animals and plants closely associated with the student's life and play are painstakingly included in a symbolic manner. On the other hand, words are written for objects that cannot be represented with shapes, such as bridges and parking lots, but only common nouns are used without any proper names of specific places. In addition, the student ran out of paper while drawing and extended the map by around one-third from the top. There is no indication of any attempt to shrink the drawing in advance to fit the entire area on the paper. There are no restrictions in terms of the map's scale, orientation, place names, or legends, as is typical of modern maps, and the student was free to depict their neighborhood with themself at the center of it.
It is said that children start being able to think abstractly from the fifth or sixth grade. In other words, they would be able to rotate a map in their mind to grasp the relationship between locations and infer distances between two points. The map described above, however, is a form of free representation that is unaffected by such demands of orientation and scale. It is truly a child's map, but one that is also sufficiently comprehensible for adults.
Topographic maps created by states since the modern era stipulate map projection to achieve metric (*1) functions and homogeneity of content, but on the other hand, these restrictions are incompatible with content such as image maps based on an individual's spatial perceptions. While this lays the groundwork for a map's positive qualities of being accurate and reliable, it may also make the map unimaginative and uninteresting to some users.
*1 A measurement standard. General maps created by measurement are known as metric maps.
- Current page: page 1
- page 2
- 1 / 2
- Next page
- The last page
MORITA Takashi
(Professor Emeritus, Hosei University)
Born in 1946. Graduated from the School of Science and Engineering, Waseda University, as well as graduate school at the same department, before completing a doctoral course at the School of Advanced Studies in the Social Sciences (EHESS) in Paris, France (PhD in Information and Communication Sciences). He was former Vice-President of the International Cartographic Association (ICA), former President of the Japan Cartographers Association, and President of the Local Organizing Committee for the 29th International Cartographic Conference (ICC 2019) held in Tokyo. His major publications include Semiotics of Graphics: Processing and Transmission of Information through Visual Language (Gurafikku no kigogaku: shikaku gengo ni yoru joho no shori to dentatsu) (trans.), God’s Eye, Bird’s Eye, Ant’s Eye: Maps as Dream Spaces for Self-Discovery (Kami no me tori no me ari no me: chizu wa jibunsagashi no yume kukan), and Encyclopedia of Maps (Chizu no jiten) (chief ed.). He is a recipient of the French Order of Arts and Letters.
The issue this article appears
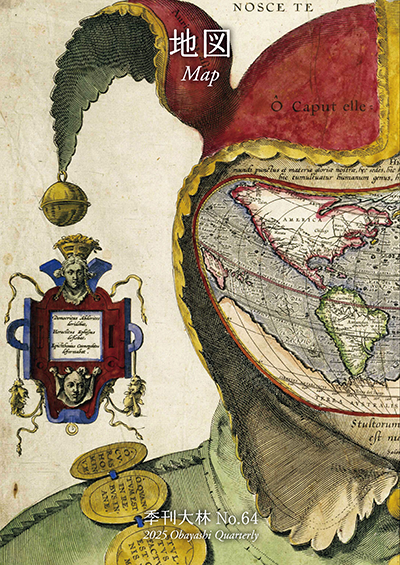
No.64 "Map"
Maps invite people into the unknown, and people get thrilled when presented with one―a simple sheet of paper.
From maps carved into rocks and historically ancient maps used in old times, to digital maps made by satellite in the modern era, we humans have been perceiving the world through a variety of maps.Not only do they help us visualize the world’s shape and overall appearance, but sometimes imaginary worlds are also constructed based on them.
In this issue showcasing various maps, we examine how people have been trying to view the world and what they are trying to see.In the Obayashi Project, we took on the challenge of deciphering and reconstructing in three dimensions a fictional city map called the Hashihara Castle Town Map (Hashiharashi Joka Ezu) drawn by Kokugaku scholar MOTOORI Norinaga when he was nineteen years old.
(Published in 2025)
-
Gravure: Is this also a map?
- View Detail
-
What Is a Map?
MORITA Takashi
(Professor Emeritus, Hosei University) - View Detail
-
The Frontiers of Maps: From the Present to the Future
WAKABAYASHI Yoshiki
(Professor Emeritus, Tokyo Metropolitan University) - View Detail
-
Visible World, Invisible World
OTA Akio
(Professor, Department of Visual Communication Design, College of Art and Design, Musashino Art University) - View Detail
-
The Dreams and Solitude of a Youth Who Drew Maps
YOSHIDA Yoshiyuki
(Honorary Director, Museum of Motoori Norinaga) - View Detail
-
OBAYASHI PROJECT
Deciphering the Hashihara Castle Town Map: The Imaginary Town of MOTOORI Norinaga
Speculative Reconstruction by Obayashi Project Team
- View Detail
-
FUJIMORI Terunobu’s “Origins of Architecture” Series No. 15: Japanese Datum of Leveling Monument
FUJIMORI Terunobu
(Architectural historian and architect; Director, Tokyo Metropolitan Edo-Tokyo Museum; and Emeritus Professor, University of Tokyo) - View Detail
-
Interesting Facts About Maps
- View Detail