Visible World, Invisible World
OTA Akio
(Professor, Department of Visual Communication Design, College of Art and Design, Musashino Art University)
Introduction
In his novel Invisible Cities (1972), Italian writer Italo Calvino portrays Marco Polo, a traveler who tells the stories of Western cities to former Yuan Dynasty emperor Kublai Khan over many days and nights (*1). These tales of cities are a mixture of fact and fiction, but regardless of the reality of these cities, it is precisely these "narratives," or "representations," evoking the cities that create a sense of the world for the emperor and for us, the readers.
*1 Calvino, I. (2003). Invisible Cities (Mienai toshi). Yonekawa, R. (trans.). Kawade Shobo Shinsha.
One such city that Marco Polo speaks of is Esmeralda, the city of water. This city has routes for various creatures, with rats running in the sewers, cats roaming the rooftops, and swallows flying freely through the sky as humans come and go via the intricately intertwined canals and overland paths. Marco Polo suggested that a map depicting such a city would have to include all these possible routes. Naturally, there has never been, and will never be, such a thing as a map depicting all possible routes. However, this episode demonstrates a keen suggestion of the fact that the object of a map is not limited to the "visible world" but contains almost infinite possibilities from the depths of the earth to the sky above, from the most miniscule to the largest, from the past to the future, and encompasses even the "invisible world." In retrospect, even the maps we normally see that we believe to be "accurate" offer only partial representations of the world.
It is impossible to depict the world as it really is. However, mankind has been endlessly experimenting in its attempt to achieve this impossible goal. New modes of representation are necessary to depict new objects. Here, I would like to review the history of maps from the perspective of "representation" and trace the struggle of mankind to overcome the limit of maps.

Challenging the limit of maps
Depicting three dimensions on flat surfaces
A map must represent a part of the earth, which is a spheroid with uneven terrain, on a flat surface, which should already be deemed extremely problematic.
The history of cartographic representation can be said to be the history of "projection methods" for accurately projecting three-dimensional objects on flat surfaces, as well as the history of "topographical depiction" for reproducing undulating terrain on flat surfaces. The earliest method of topographical depiction involved forcibly drawing mountains seen from the side or a high angle on maps from an overhead perspective. While this method could not be said to be accurate as it included imagery drawn from one's imagination, it was, on the contrary, the only way to depict unfamiliar places in a faithful manner. This pictorial representation possessed tremendous evocative power in terms of topography and may have sparked the passion for travel and exploration in many people, but it lacked practicality and was somewhat unsatisfactory as many landmarks were hidden behind the mountains depicted on the maps.

de Saussure, H. (1779-96). Voyages dans les Alpes, Neuchatel: Fauche-Borel, 1779-96 (Source: BGE, Bibliothéque de Genéve).
The emergence of a mode of representation known as "hachures" addressed the shortcomings of the pictorial method of topographical depiction. Hachures attempted to create three-dimensional impressions of slopes with the density and spread of lines, and although they lacked the representational power of the pictorial method for capturing undulating terrain, they were able to overcome many of the previous method's shortcomings. Despite hachures becoming the dominant method of depicting undulating terrain for a long time, significant doubt persisted where reality is concerned.

Hauptm. Rosenberg (main author), Joseph List, Battle of Zurich on June 4, 1799 (Schlacht bey Zürich am 4ten Juny 1799) Vienna: printed by Anton Strauss, 1819 (Source: BGE).
Other methods were eventually developed, including depicting mountains using shadows in the presence of sunlight, varying the thickness of hachures to represent shadows, and creating actual reliefs of the terrain, illuminating them, and photographing them for use as maps. These methods of depiction, which were developed in tandem with intricate copperplate engraving techniques, pushed topographical depiction to its peak from the late 19th century to the early 20th century in terms of its representational power and aesthetic beauty.

Collin, C. E. (ca. 1860). The Bay of Naples and Mount Vesuvius (La rade de Naples et le Vésuve) (Source: BGE)
As time went on, with the development of surveying, "contour lines" that connect points with the same elevation as well the coloring of areas bounded by contour lines based on their elevation were put to practical use and accepted as scientifically accurate. However, these techniques could not offer perceptually satisfactory three-dimensional impressions and were generally combined with line drawings and color shading for representing shadows to create composite modes of representation. In other words, the conflict between scientific accuracy and the intuitiveness of representation has yet to be resolved.
- Current page: page 1
- page 2
- 1 / 2
- Next page
- The last page
OTA Akio
(Professor, Department of Visual Communication Design, College of Art and Design, Musashino Art University)
Born in 1981. Completed a master’s course at Musashino Art University and doctoral course requirements without a degree at Shibaura Institute of Technology. He conducts research on information visualization with a focus on diagrams and thematic maps. His book The World on a Sheet of Paper: The Birth of Diagrams and Thematic Maps that Changed History (Sekai wo ichimai no kami no ue ni: rekishi wo kaeta daiaguramu to shudai chizu no tanjo) won the Japan Cartographers Association Award (Publication Award).
The issue this article appears
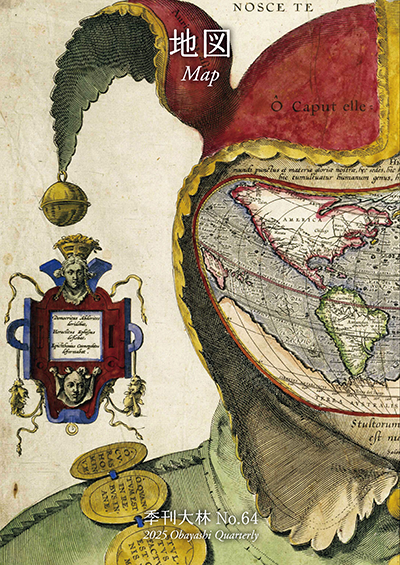
No.64 "Map"
Maps invite people into the unknown, and people get thrilled when presented with one―a simple sheet of paper.
From maps carved into rocks and historically ancient maps used in old times, to digital maps made by satellite in the modern era, we humans have been perceiving the world through a variety of maps.Not only do they help us visualize the world’s shape and overall appearance, but sometimes imaginary worlds are also constructed based on them.
In this issue showcasing various maps, we examine how people have been trying to view the world and what they are trying to see.In the Obayashi Project, we took on the challenge of deciphering and reconstructing in three dimensions a fictional city map called the Hashihara Castle Town Map (Hashiharashi Joka Ezu) drawn by Kokugaku scholar MOTOORI Norinaga when he was nineteen years old.
(Published in 2025)
-
Gravure: Is this also a map?
- View Detail
-
What Is a Map?
MORITA Takashi
(Professor Emeritus, Hosei University) - View Detail
-
The Frontiers of Maps: From the Present to the Future
WAKABAYASHI Yoshiki
(Professor Emeritus, Tokyo Metropolitan University) - View Detail
-
Visible World, Invisible World
OTA Akio
(Professor, Department of Visual Communication Design, College of Art and Design, Musashino Art University) - View Detail
-
The Dreams and Solitude of a Youth Who Drew Maps
YOSHIDA Yoshiyuki
(Honorary Director, Museum of Motoori Norinaga) - View Detail
-
OBAYASHI PROJECT
Deciphering the Hashihara Castle Town Map: The Imaginary Town of MOTOORI Norinaga
Speculative Reconstruction by Obayashi Project Team
- View Detail
-
FUJIMORI Terunobu’s “Origins of Architecture” Series No. 15: Japanese Datum of Leveling Monument
FUJIMORI Terunobu
(Architectural historian and architect; Director, Tokyo Metropolitan Edo-Tokyo Museum; and Emeritus Professor, University of Tokyo) - View Detail
-
Interesting Facts About Maps
- View Detail