Visible World, Invisible World
OTA Akio
(Professor, Department of Visual Communication Design, College of Art and Design, Musashino Art University)
Maps and time
On the other hand, if we approach maps from the perspective of "time," we can see that they are even more questionable. Maps do not depict an eternally immutable world but serve as montage-like images created by piecing together information available at specific points in time like a patchwork.
The map of ancient Rome presented below depicts an idealized representation of ancient Rome reconstructed by its creator Piranesi (1720-78), who was also an architect, based on archaeological research of ancient Roman ruins with the goal of depicting not only what it would have looked like but also what it should have been. This map was created not with the purpose of accurately restoring the past but to depict an idealized representation from the horizon of the present and a possible impression of the city that contained a huge dose of the creator's own intent. It would be easy to dismiss the map as nothing more than a fantasy, but Piranesi did not fall prey to the false promises of "restoration" and the "reality of maps." Instead, it could be said that he made a giant leap toward embracing maps as hypothetical creative works that allowed for mistakes.
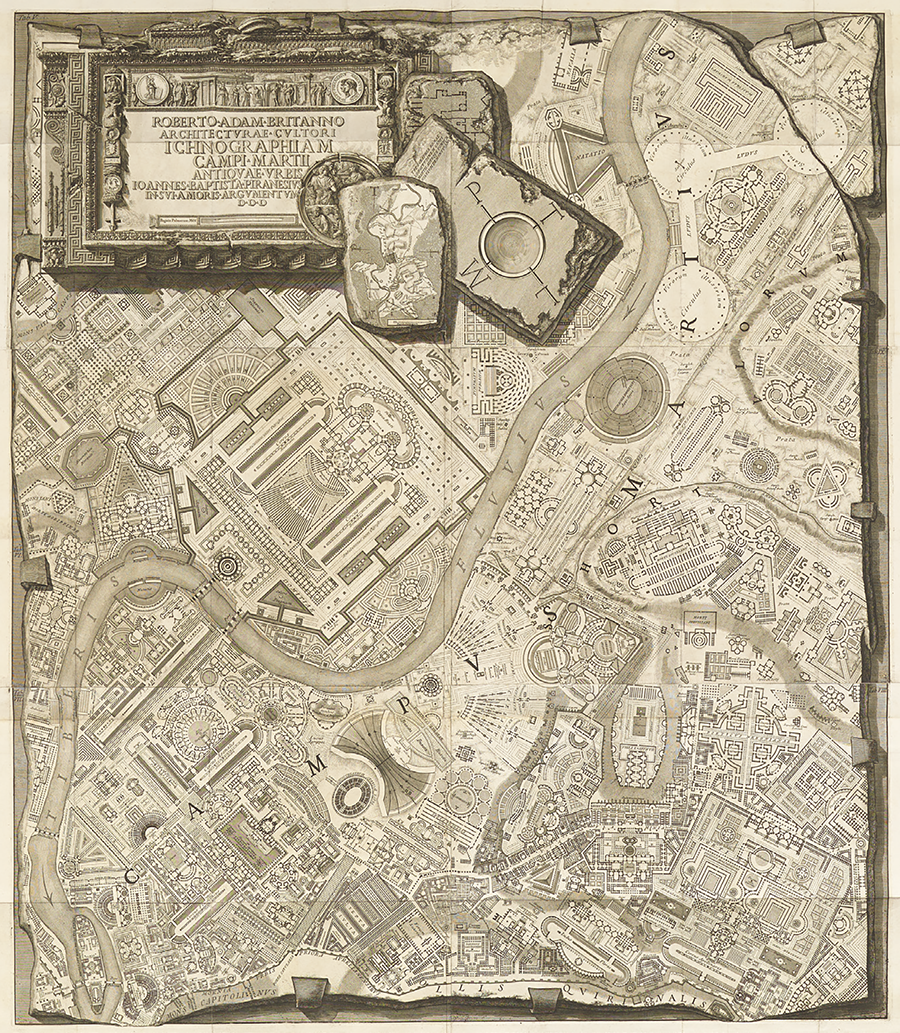
Piranesi, G. B. (1762). Ichnographia of the Campus Martius of the Ancient City (Ichnographiam Campi Martii antiquae urbis) (Source: The Arthur Ross Collection, Yale University)
It is also commonly accepted that maps are meant to represent space, whereas the role of graphs and timelines is to show changes over time. However, there are situations in which a map is required to depict "changes" in a particular location. For example, it is essential when teaching history to depict "changes" such as the movement of peoples or the expansion and contraction of political boundaries.
The Historical Atlas shown in the three figures below is a representation of how the extent of the world known to people in the West expanded over time. The artist adopted the unique approach of depicting the unknown world not as blank spaces but as thick clouds and jet-black darkness, and he successfully portrayed the "changes" in the West's historical worldview through pages that resemble a series of photographs. Such a mode of representation was the only way to depict change in the days when maps were only printed on paper, but it would be possible to do this today using animation as well. If the methods of depicting change continue to develop going forward, students may no longer have to worry in high school history classes.
-
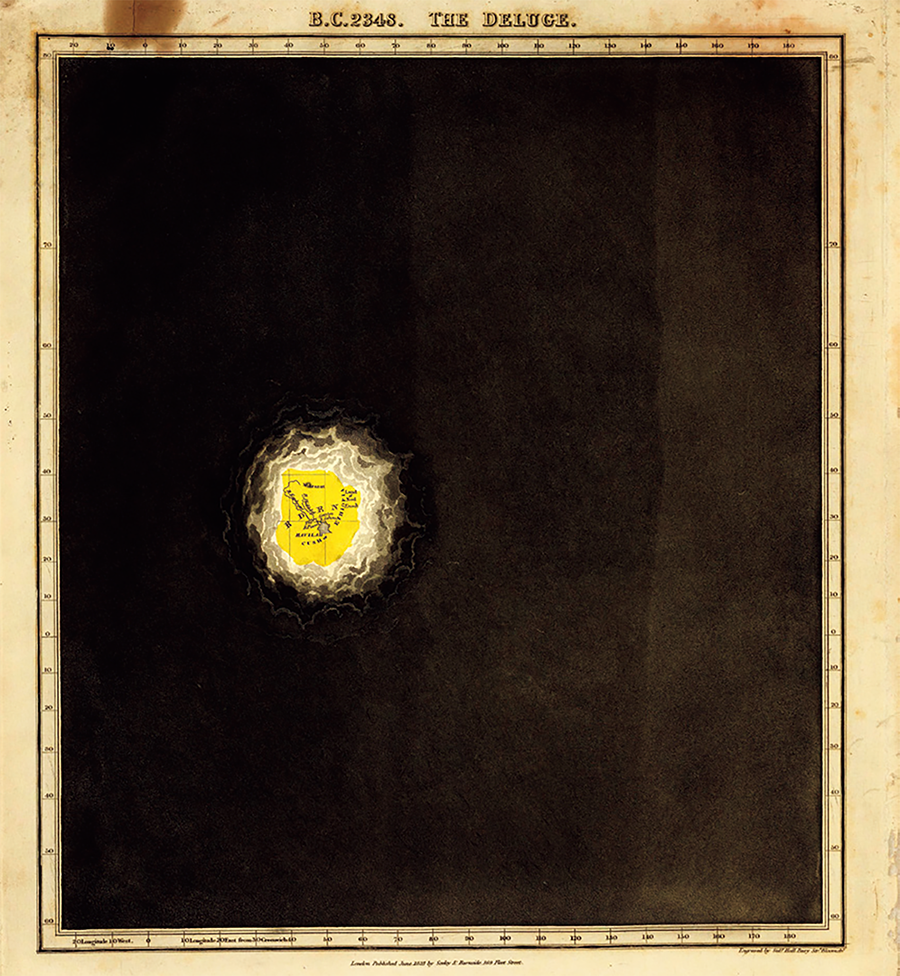
"B.C. 2348: The Deluge"
-
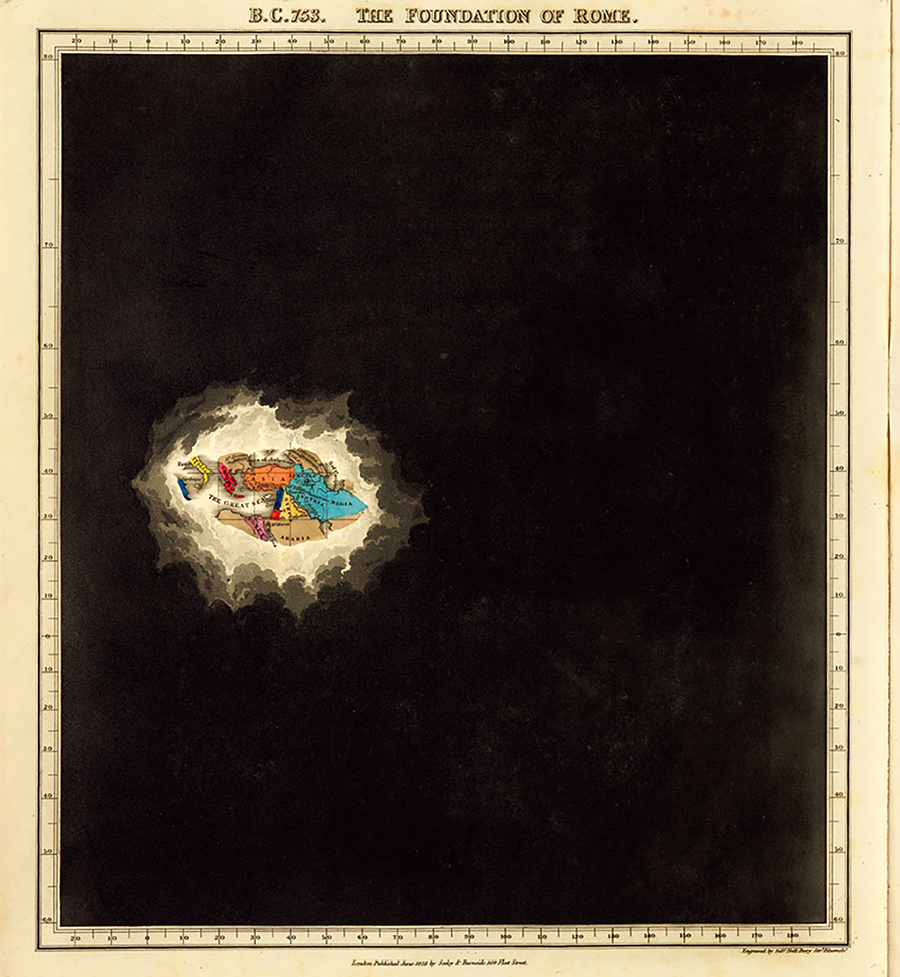
"B.C. 753: The Foundation of Rome"
-
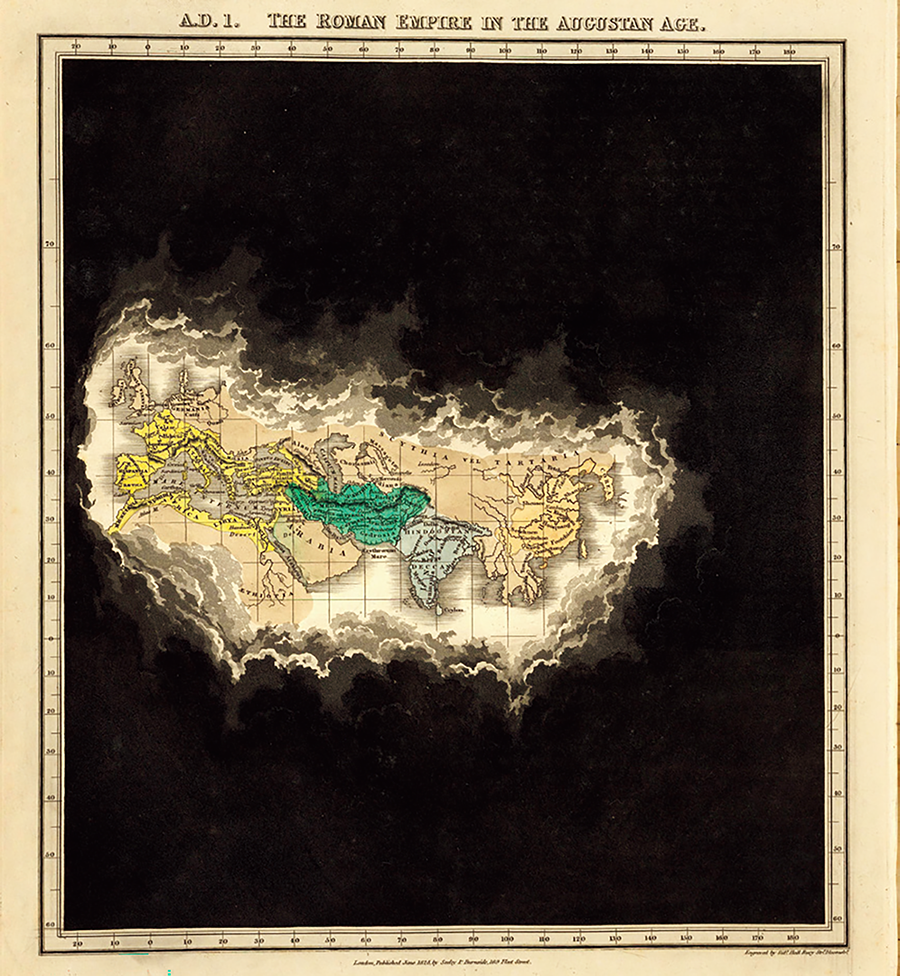
"A.D. 1: The Roman Empire in the Augustan Age"
from Historical Atlas by Edward Quin
Quin, E. (1830). Historical Atlas. (Source: David Rumsey Historical Map Collection)
Depicting layers
Maps are generally thought of as depictions of only a single visible layer on "the surface of the earth." Although multiple things are happening simultaneously in the world from the depths of the earth to the sky above, a map can only depict a single surface. But is that really the case?
Mankind is not satisfied with simply building above ground but is also expanding usable space by digging underground to create basements, subways, underground malls, and sewers. This fascinating biological behavior is reminiscent of ants building their nests and moles digging underground passages. The figure below shows a map of the underground spaces created in the city of Paris in France in the 19th century. In Paris, stones were mined from underground for use as building materials in construction above ground, and a labyrinth of underground spaces was created as a result of many years of unchecked mining. In the 18th century, these spaces began to be utilized as underground cemeteries as a means of making effective use of them, but a series of cave-ins led to the need for systematic study and management of these underground spaces. Created under these circumstances, this atlas is a very rare map in the history of maps as one that combines underground layers with those above ground. Indeed, this map stirs the imagination of what would happen if we were to create similar maps in a modern city such as Shinjuku or Shibuya, where rows of skyscrapers stand right above underground malls.
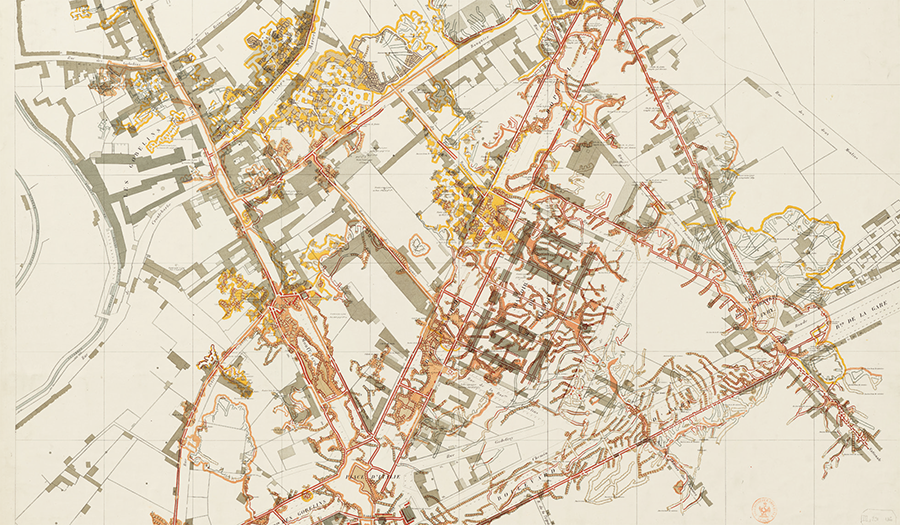
De Fourcy, E.(1855). (cartographe), Atlas souterrain de la ville de Paris, Paris: Impr. de Vinchon. (Source: BnF)
Depicting spaces experienced
The world to be depicted in maps will eventually shift from the mere physical environment to the world as perceived and recognized by people.
The figure below shows a map created to examine the ideal driving experience on a highway. Kevin Lynch, the urbanist who directed this project, analyzed the landscape as seen from a car driving on Boston's highways and captured through this map the physical sensations created by the relationship between the physical environment and the movement of the car, as well as changes in the view. Radial lines are used to indicate the points of the highway from which the sensations are perceived, including Charles River that flows from the left side of the map to the harbor area on the right, hills that are depicted by contour lines, and skyscrapers on the peninsula that are represented as a group of black triangles. Through this map-based analysis, Lynch sought to capture "the spaces experienced" through the mutual interaction between the subject in motion and the physical environment. There exist as many forms of the world as there are subjects living in it. This is the map that provided this fresh insight.
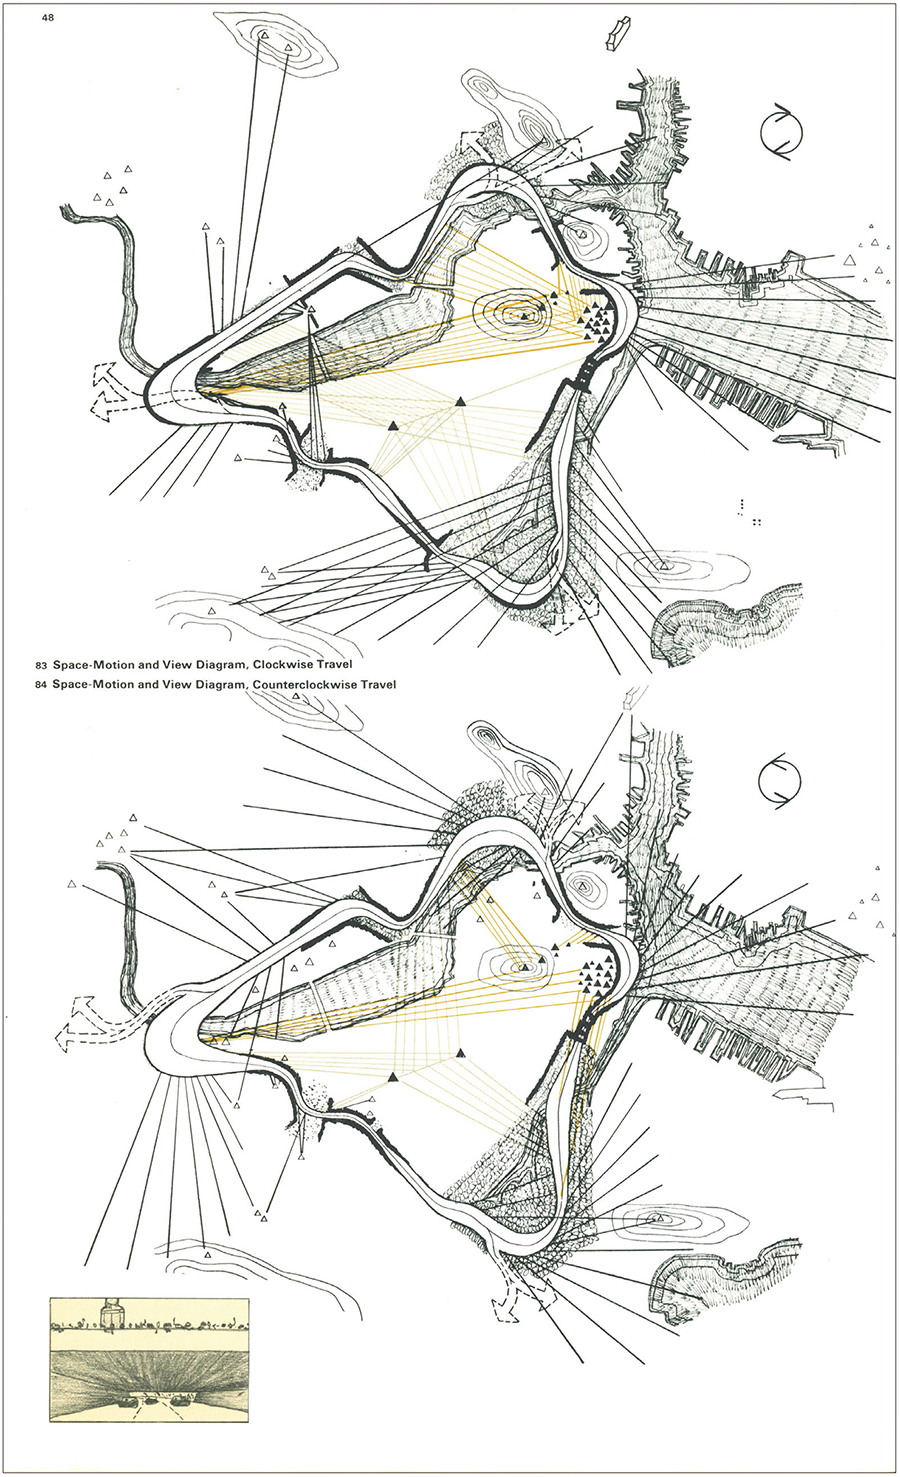
Lynch, K., Appleyard, D., and Myer, J. R. (1965). The View from the Road, The MIT Press.
The persistent challenges surrounding maps
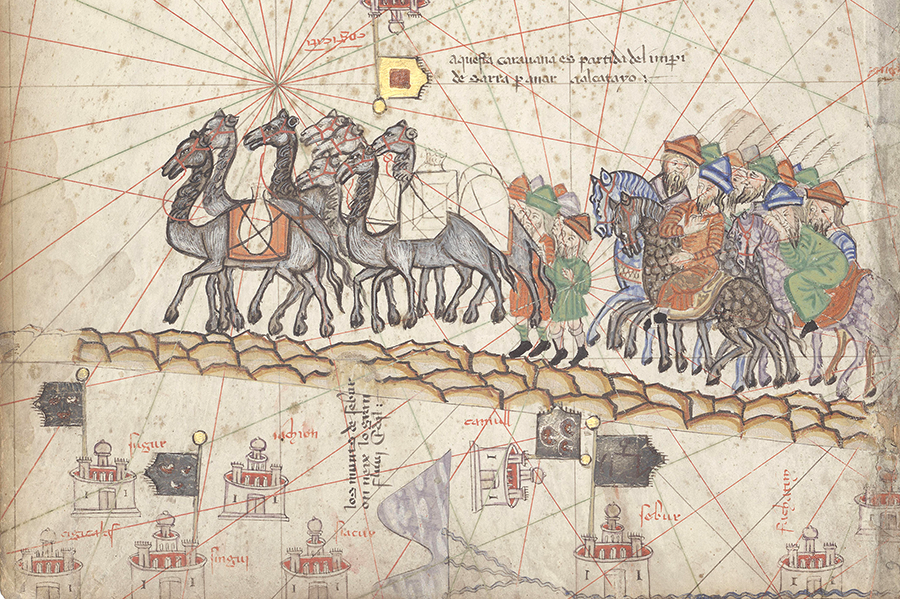
Cresques, A. (1375). Detail from the Catalan Atlas.
©Aflo
The maps introduced hitherto are special maps that differ from what usually comes to mind when the word "map" is mentioned. Of course, I do not mean to suggest that, for those of us living in the real world, "representation" should take precedence as a substitute for the "world" as it is. However, as in Calvino's novel, there are no doubt situations in which the question of how the world should be "represented" becomes more important than the real world.
As we walk down the street, we often see people staring at their smartphones and using maps to find their way. They are looking at "maps" that are depictions of spaces rather than at real spaces. What is "represented" on a "map" and "how" it is represented thus precedes the real space itself.
The generation that used to unfurl a map to satisfy their curiosity may eventually vanish. However, the medium of "maps," which mediate between imagination and reality and between the known and the unknown, will continue to be created in different forms. I hope there will be new modes of cartographic representation that will take us to worlds we have seen but have not seen before.
- The first page
- Previous page
- page 1
- Current page: page 2
- 2 / 2
OTA Akio
(Professor, Department of Visual Communication Design, College of Art and Design, Musashino Art University)
Born in 1981. Completed a master’s course at Musashino Art University and doctoral course requirements without a degree at Shibaura Institute of Technology. He conducts research on information visualization with a focus on diagrams and thematic maps. His book The World on a Sheet of Paper: The Birth of Diagrams and Thematic Maps that Changed History (Sekai wo ichimai no kami no ue ni: rekishi wo kaeta daiaguramu to shudai chizu no tanjo) won the Japan Cartographers Association Award (Publication Award).
The issue this article appears
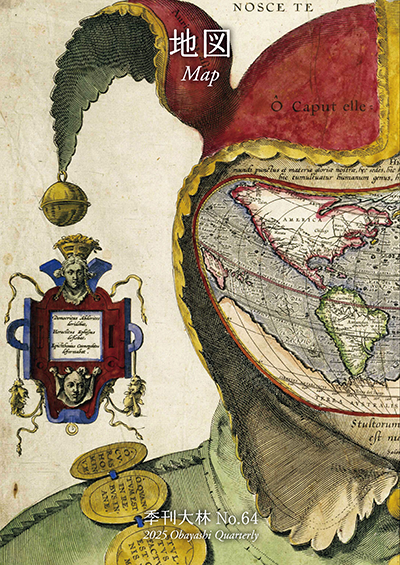
No.64 "Map"
Maps invite people into the unknown, and people get thrilled when presented with one―a simple sheet of paper.
From maps carved into rocks and historically ancient maps used in old times, to digital maps made by satellite in the modern era, we humans have been perceiving the world through a variety of maps.Not only do they help us visualize the world’s shape and overall appearance, but sometimes imaginary worlds are also constructed based on them.
In this issue showcasing various maps, we examine how people have been trying to view the world and what they are trying to see.In the Obayashi Project, we took on the challenge of deciphering and reconstructing in three dimensions a fictional city map called the Hashihara Castle Town Map (Hashiharashi Joka Ezu) drawn by Kokugaku scholar MOTOORI Norinaga when he was nineteen years old.
(Published in 2025)
-
Gravure: Is this also a map?
- View Detail
-
What Is a Map?
MORITA Takashi
(Professor Emeritus, Hosei University) - View Detail
-
The Frontiers of Maps: From the Present to the Future
WAKABAYASHI Yoshiki
(Professor Emeritus, Tokyo Metropolitan University) - View Detail
-
Visible World, Invisible World
OTA Akio
(Professor, Department of Visual Communication Design, College of Art and Design, Musashino Art University) - View Detail
-
The Dreams and Solitude of a Youth Who Drew Maps
YOSHIDA Yoshiyuki
(Honorary Director, Museum of Motoori Norinaga) - View Detail
-
OBAYASHI PROJECT
Deciphering the Hashihara Castle Town Map: The Imaginary Town of MOTOORI Norinaga
Speculative Reconstruction by Obayashi Project Team
- View Detail
-
FUJIMORI Terunobu’s “Origins of Architecture” Series No. 15: Japanese Datum of Leveling Monument
FUJIMORI Terunobu
(Architectural historian and architect; Director, Tokyo Metropolitan Edo-Tokyo Museum; and Emeritus Professor, University of Tokyo) - View Detail
-
Interesting Facts About Maps
- View Detail