The Frontiers of Maps: From the Present to the Future
WAKABAYASHI Yoshiki
(Professor Emeritus, Tokyo Metropolitan University)
Changes in cartographic representations
Although drawing different maps from the same data was something also seen during the analog era, digitalization has expanded the scope of representation to allow a wide variety of maps to be drawn in three dimensions (3D) and through the use of video, virtual reality (VR), augmented reality (AR), audio, and other means.
The ease of creating 3D maps is attributable to the fact that digital elevation data is now publicly available and can be used freely. The accuracy of digital elevation data has improved dramatically as a result of aerial laser surveying, in which laser scanners mounted on aircraft and UAVs (drones) shine laser beams on the ground and measure the distance to the ground based on the time lag between laser beams reflected from the ground. Such data is also being used in PLATEAU, a nationwide 3D urban model development and open data project promoted by the Ministry of Land, Infrastructure, Transport and Tourism, with the number of 3D maps using this data expected to increase going forward.
Spatiotemporal 3D maps created by adding a time axis to such maps can now be easily made using GIS. The figure below, which applies this to the state of transmission of COVID-19, plots the number of infected persons on spatiotemporal coordinates using data on the location and date of reported COVID-19 cases, converts this information to density, and represents it as a cloud-like mass.
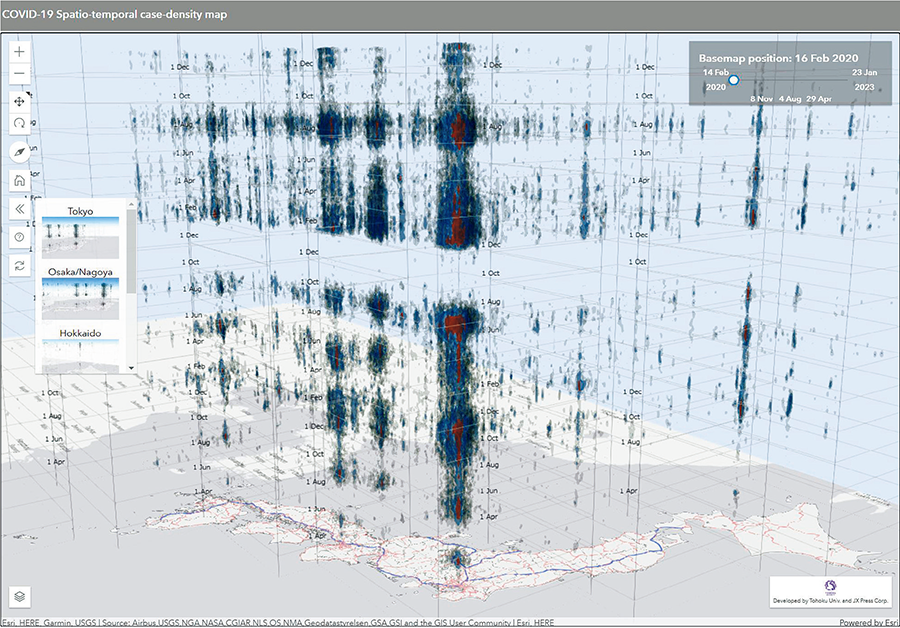
Spatiotemporal 3D map showing the spread of COVID-19 from February 2020 (bottom of figure) to January 2023 (top of figure). Red, blue, and gray areas represent regions with outbreaks in at least five facilities each day, at least one facility each day, and around one facility every four days, respectively. By sliding the time axis, you can see that COVID-19 repeatedly spread from the metropolitan area to the surrounding areas from the first wave to the eighth wave.
Source: COVID-19 Spatio-temporal case-density map by NAKAYA Laboratory, Tohoku University https://nakaya-geolab.com/covid19-stkd/japan/
Furthermore, VR representations are also becoming more accessible. An example of the VR mapping of current and past landscapes is Ritsumeikan University's "Virtual Kyoto". This was created by superimposing photographic images on building shape data obtained by laser surveying, and it has been made publicly available on the Internet as a VR map that allows users to fly through or walk through virtual spaces in the heart of Kyoto City. Such technology is also being applied to the space of the metaverse. On the other hand, AR refers to the superimposition of maps and physical spaces in reality. This includes Pokémon GO, which has gained popularity as a game that makes use of location information.

Source: "Virtual Kyoto and Gion Festival" (3D/detailed model), Art Research Center, Ritsumeikan University https://www.arc.ritsumei.ac.jp/lib/vm/gionfestivalDM/
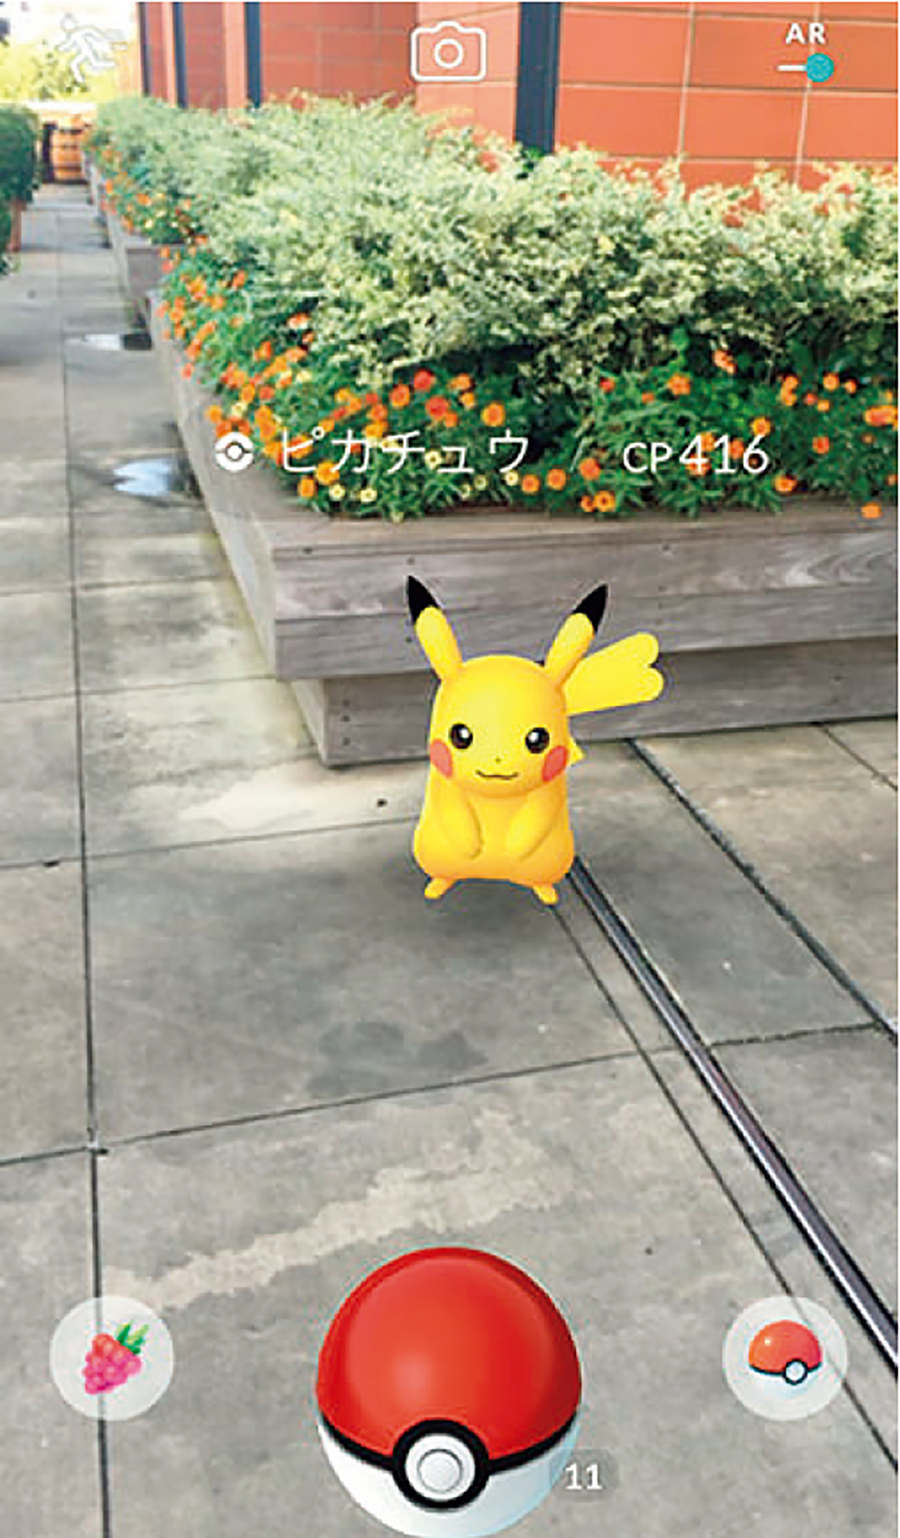
©2025 Niantic, Inc.
©2025 Pokémon.
©1995-2025 Nintendo / Creatures Inc. / GAME FREAK inc.
Animated maps that add movement and change to the visual representation of maps have also become easier to create with digitalization. Digital geospatial information can also be converted into audio and used for voice communication in car navigation systems and smartphone navigation functions. This complements visual maps while simultaneously creating barrier-free maps for the visually impaired.
Given the diversification of map representation forms with the addition of multimedia representation, opportunities to represent maps visually as in the past may diminish. In particular, location-based services (LBS), which provide services by processing geospatial information with computers, often convert such information into text or audio or process it internally instead of representing it as maps. Therefore, while map information has become more widely used through digitalization, it is also being rendered invisible.
Changes in uses of maps
According to the 2023 White Paper on Information and Communications in Japan, the personal smartphone usage rate is over 70% and around 60% of the population uses digital services for maps and navigation. This suggests that more than half of the population views maps on smartphones. As the use of maps via the Internet gains traction, environments will be set up to allow anyone to use maps anytime, anywhere. This situation also known as ubiquitous mapping is a major change brought about by the digitalization of maps.
Of these targets, "anytime" and "anywhere" have been almost achieved in Japan, where the household coverage of fiber-optic Internet access is over 99%. However, "anyone" has not necessarily been achieved at this point in time, as there still exists a digital divide (information gap). In particular, some elderly people, among whom the usage rate of smartphones and other communication devices is low, are still unable to benefit from digitalization, including online maps.
At the same time, the author's survey of online map use has revealed a difference in the use of maps between digital natives, who grew up surrounded by digital devices from the time they were born, and digital immigrants, who first came into contact with computers as adults, with younger individuals more likely to rely on smartphone maps. However, recent studies have shown that information that can be found by searching online tends to be harder to commit to memory (digital amnesia), raising concerns about the reliance on smartphones among young people. It has also been pointed out that when searching online for a map and the desired location is pinpointed, there is a risk of the user restricting their focus without looking outside of the location, making the route difficult to commit to memory when finding one's way using a navigation app. To avoid these negative effects of digitalization, it may be more effective to change the scale of the map, move the display area to look at the surrounding area, and use digital maps in conjunction with analog maps that offer a better view of the surroundings.
What will remain unchanged with digitalization and the future of maps
As the digitalization of maps gains traction, it is expected that the creation of future maps will become automated by new technologies such as AI. However, the decision of what and how to encode and represent the real world on a map is ultimately left to humans. The technique of cartographic generalization, in which map symbols are simplified or omitted as necessary to make maps easier to read, remains a task that is challenging to automate, and map design is not yet at a stage where all tasks can be automated. In terms of map use, there are also concerns about negative effects such as the digital divide and digital amnesia outlined above, making it likely that analog maps will continue to coexist with digital maps for the time being. In such cases, analog and digital maps, which have their own strengths and weaknesses, should complement each other.
Although the digitalization of geospatial information may increase the opportunities to utilize such information without representing it as maps, the skill of reading maps as visual representations will basically remain the same as in the analog era. However, map reading may become easier depending on the design of the user interface for retrieving information helpful for reading the map. In fact, geographic visualization tools have been developed to represent various geospatial information in an aggregated manner on a single map and for reading information in an exploratory manner. For example, the figure below illustrates an exploratory analysis of the relationships between various population data items for the Tokyo metropolitan area using the GeoViz Toolkit developed by The Pennsylvania State University. Combining not only maps but also graphs and other graphical modes of representation can serve to capture information hidden in the data from multiple perspectives.
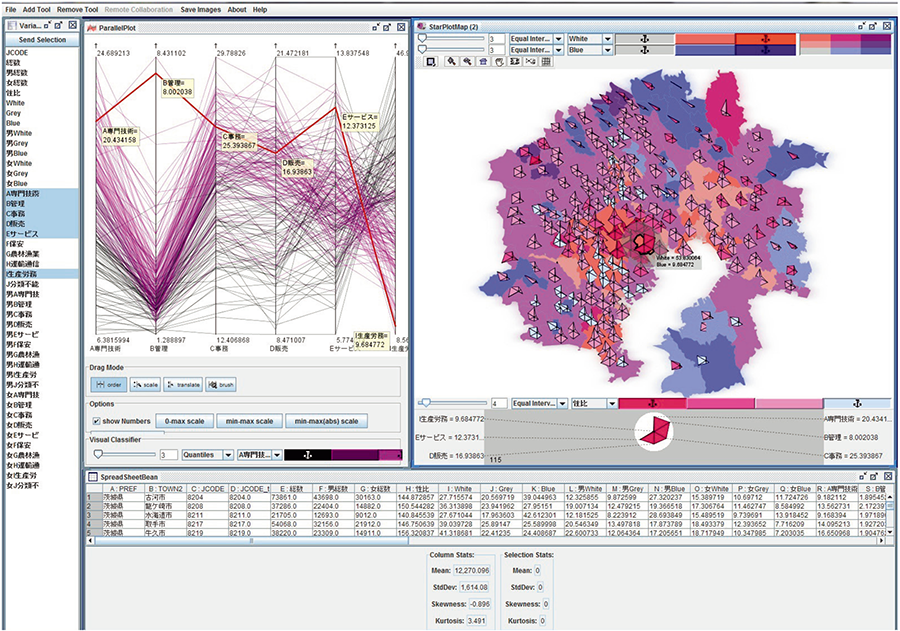
The left figure shows a parallel coordinate plot depicting six major occupational categories, and the right figure shows a star chart depicting the population by gender and occupation over a color-coded map of white-collar and blue-collar workers. The star chart is color-coded according to the gender ratio of the workers and simultaneously maps a total of seven different variables. To see the correspondence between the left and right figures, the values for Minato Ward, Tokyo, in the right figure are shown with a thick red line in the left figure. However, its trend which is different from other areas suggests that the area is unique in terms of its occupational composition.
Source: Wakabayashi, Y., and Koizumi, R. (2012). "Application of Geovisualization as a Method for Exploratory Spatial Data Analysis: The Case of Demographic Data for Tokyo Metropolitan Area (tansakuteki kukan deta kaiseki no tame no chiriteki kashika tsuru no oyo - tokyo daitoshiken no jinko deta e no tekiyo jirei)," Map (chizu), vol. 50, no. 2.
Such tools that visualize a massive amount of data using maps and graphs are called dashboards. Dashboards have become widely known through their use, for instance, by Johns Hopkins University, whose dashboard was among the first to visualize the global spread of COVID-19.
New skills and knowledge different from those used for existing analog maps are required to make the most of digital maps featuring these novel modes of representation and interfaces, making a review of map literacy necessary as well. An understanding of digital technology is also essential for such a new form of map literacy.
- The first page
- Previous page
- page 1
- Current page: page 2
- 2 / 2
WAKABAYASHI Yoshiki
(Professor Emeritus, Tokyo Metropolitan University)
Born in 1959. Graduated from Doctoral Course of Graduate School of Letters, Hiroshima University. PhD. His specialty is geography, cartography and geographic information science. His main publications are How to Read and Make Maps in a Digital Society (Dejitaru shakai no chizu no yomikata tsukurikata), Evolution of Maps (Chizu no shinkaron: chirikukanjoho to ningen no mirai), Theory and Applications of Participatory GIS (Sankagata GIS no riron to oyo), and Ubiquitous Mapping.
The issue this article appears
No.64 "Map"
Maps invite people into the unknown, and people get thrilled when presented with one―a simple sheet of paper.
From maps carved into rocks and historically ancient maps used in old times, to digital maps made by satellite in the modern era, we humans have been perceiving the world through a variety of maps.Not only do they help us visualize the world’s shape and overall appearance, but sometimes imaginary worlds are also constructed based on them.
In this issue showcasing various maps, we examine how people have been trying to view the world and what they are trying to see.In the Obayashi Project, we took on the challenge of deciphering and reconstructing in three dimensions a fictional city map called the Hashihara Castle Town Map (Hashiharashi Joka Ezu) drawn by Kokugaku scholar MOTOORI Norinaga when he was nineteen years old.
(Published in 2025)
-
Gravure: Is this also a map?
- View Detail
-
What Is a Map?
MORITA Takashi
(Professor Emeritus, Hosei University) - View Detail
-
The Frontiers of Maps: From the Present to the Future
WAKABAYASHI Yoshiki
(Professor Emeritus, Tokyo Metropolitan University) - View Detail
-
Visible World, Invisible World
OTA Akio
(Professor, Department of Visual Communication Design, College of Art and Design, Musashino Art University) - View Detail
-
The Dreams and Solitude of a Youth Who Drew Maps
YOSHIDA Yoshiyuki
(Honorary Director, Museum of Motoori Norinaga) - View Detail
-
OBAYASHI PROJECT
Deciphering the Hashihara Castle Town Map: The Imaginary Town of MOTOORI Norinaga
Speculative Reconstruction by Obayashi Project Team
- View Detail
-
FUJIMORI Terunobu’s “Origins of Architecture” Series No. 15: Japanese Datum of Leveling Monument
FUJIMORI Terunobu
(Architectural historian and architect; Director, Tokyo Metropolitan Edo-Tokyo Museum; and Emeritus Professor, University of Tokyo) - View Detail
-
Interesting Facts About Maps
- View Detail